How can we make complex processes easier to understand and complete?
I developed and refined the flowcharts showcased in this case study through real-world experience and research over the course of my career.
When many people, things, or steps are involved in a project or task, the process can be hard to explain or teach. I frequently used flowcharting to document processes and explore opportunities for improvements.
Situation, Problems, and Opportunities
I’ve always been passionate about continuous improvement. Throughout my career, I’ve focused on optimizing operations for efficiency. To achieve this, I’ve often pondered questions like:
- How can we help enhance understanding and performance within the organization?
- How can we standardize processes while allowing for flexibility and innovation?
- How can we continuously adapt improvement strategies in rapidly changing environments?
- How can we effectively document and share best practices across the organization?
- How can we gather and analyze data to identify areas for improvement?
- How can we identify inefficiencies and bottlenecks in existing processes?
Flowcharting has been a valuable tool for me in various situations. I create flowcharts to visually map processes, helping me understand relationships and dependencies, even in complex projects.
For instance, I’ve established clear call transfer protocols through flowcharts, clarifying roles and structure. I’ve also designed workflows for seamless client onboarding and visualized website user journeys, such as profile creation, sign-in, and password resets.
Here are three specific examples of how I’ve streamlined and documented the repeatable parts of processes and workflows, reduced confusion and inefficiencies, and increased team productivity.
A Project Workflow Process
How can we efficiently explain processes where many people, things, or steps are involved?
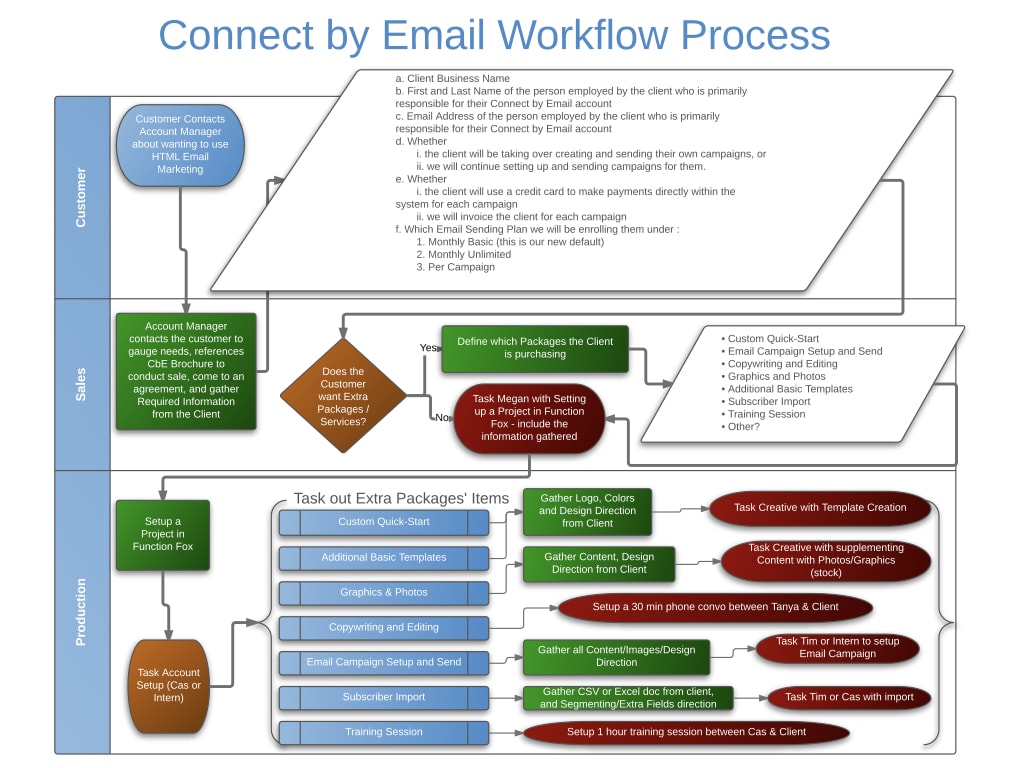
To initiate an HTML email project, Account Managers needed to provide specific client information and assets to our teams. Additionally, the assets and team members involved varied based on the client’s chosen service level. This could quickly lead to confusion and create bottlenecks in our production process.
Using sketches and flowcharts, I documented these details and formats for each service level. Then I streamlined the process using a concise one-sheet workflow I distributed to everyone involved. Following the flowchart improved team organization and efficiency. Team morale was improved and we got more projects done faster, leading to increased production capacity and revenue.
A Personal Code Deployment Process
How can we efficiently and reliably document, test, and deploy frequent code changes?
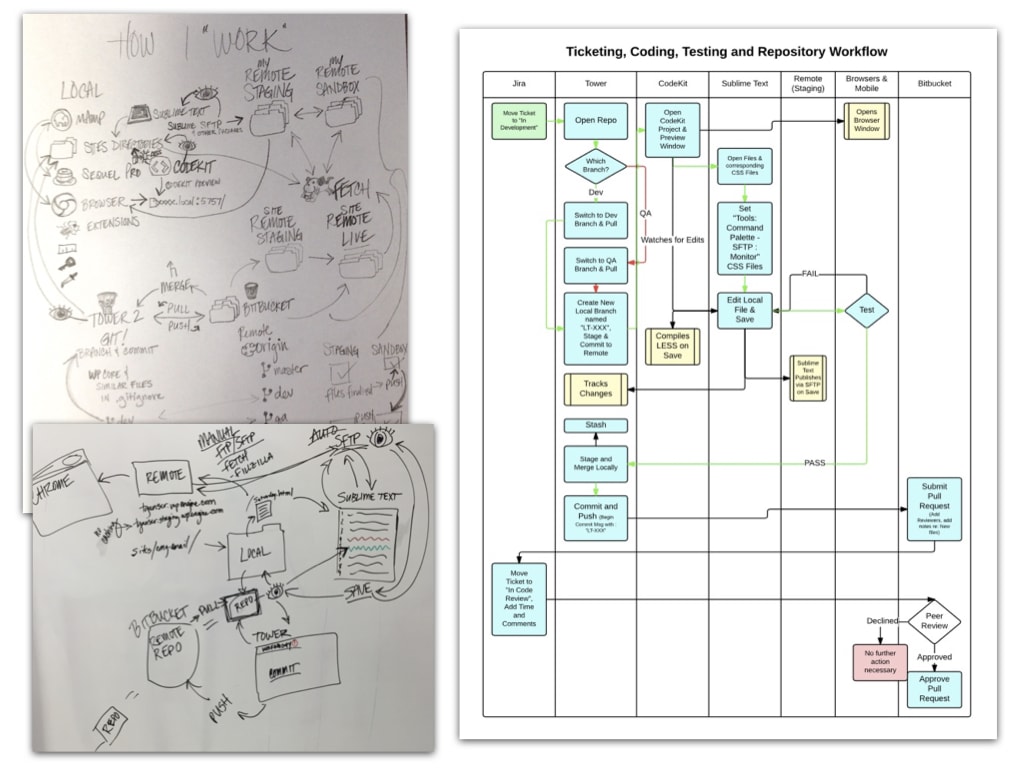
As a Senior Front End Developer in an Agile team, my process for writing and deploying code had many steps. Accidentally overlooking any was easy to do and time-consuming to fix.
I used tickets in Jira, Sublime Text for coding HTML and CSS, Repos in Tower, and CodeKit for LESS compilation. To QA and troubleshoot my code on multiple browsers and devices, I used Local and Remote Staging servers. And our team used Bitbucket to submit Pull Requests to add to Production.
So, I made a flowchart to help me. This chart guided me from the time I grabbed a ticket through peer review and pull request approval. I used swimlane symbols to clarify where actions and decisions happened in our system.
This flowchart helped me work faster, cut down on mistakes, and quickly onboard other developers who needed to follow our CI/CD process.
An Online User Registration Process
How can we efficiently and reliably document and QA test complex online processes?
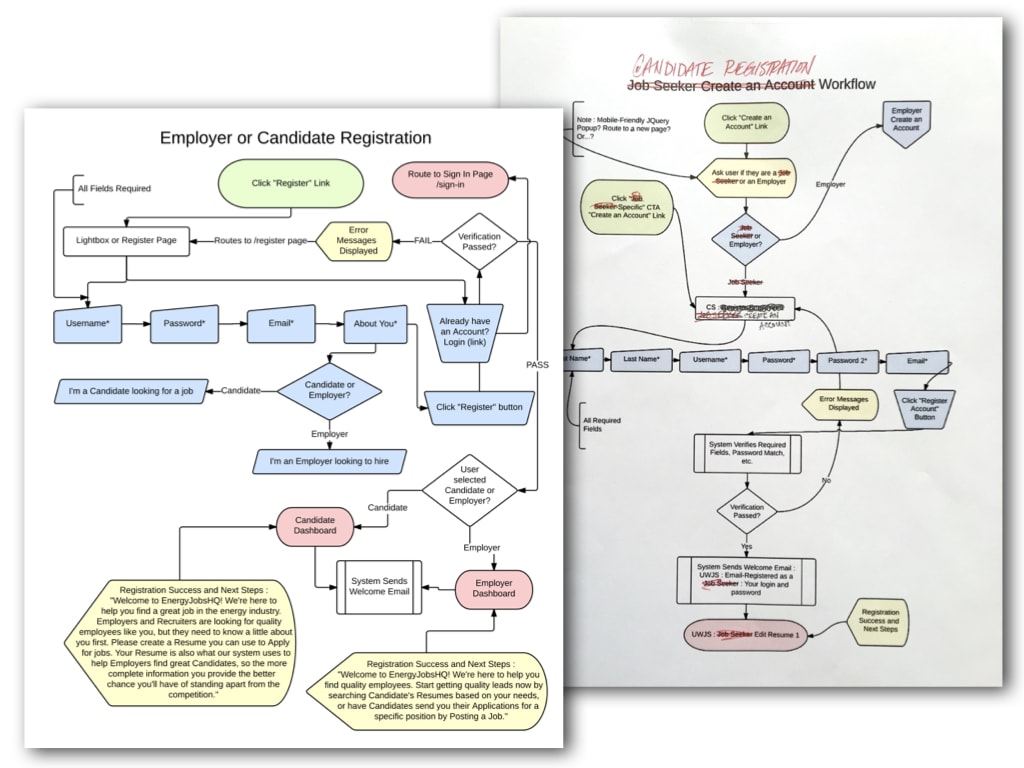
Precise bug reporting while building an online job board SaaS required an organized method for repeatedly manually QA testing processes like Candidate Registration. I designed a detailed flowchart covering every step and input in the registration workflow. I quickly realized the parallel workflow for Employers/Recruiters could be merged with it.
The visualizations I created had a tremendous impact on product and project management by helping us quickly identify inefficiencies, improve communication, and facilitate collaboration. Using this unified, comprehensive flowchart, both the development team and I efficiently QA tested registration processes, reducing development timeframes to streamline our operations. We also this and other flowcharts I maintained in conjunction with the personas and user stories I created to validate user journeys and simplify necessary and complex processes.
The journey to enhance understanding, streamline processes, and boost efficiency has been a hallmark of my career.
Through practical experience and diligent research, I developed and refined flowcharting techniques that proved invaluable in making complex operations more accessible. Addressing the challenges of intricate processes, I employed flowcharts to visualize and map out various scenarios, helping me uncover relationships and dependencies that were otherwise hard to discern.
By applying this method, I optimized processes in different domains, from project workflows and code deployment to user registration procedures.
These examples underscore how flowcharting transformed complex operations into manageable, transparent processes, fostering understanding, collaboration, and improved outcomes. The application of these principles, guided by the questions of how to streamline, standardize, and adapt, showcases the power of visualizing complexity for the betterment of organizations and projects.